The Underestimated Variables Behind Reply Probability
Reply rates aren’t driven by copy alone. Explore the overlooked variables—data quality, ICP precision, timing, and engagement signals—that shape reply probability.
INDUSTRY INSIGHTSLEAD QUALITY & DATA ACCURACYOUTBOUND STRATEGYB2B DATA STRATEGY
CapLeads Team
2/19/20263 min read
Reply rate is often treated like a messaging score.
If it rises, the copy worked.
If it falls, the angle failed.
That interpretation is comfortable — and incomplete.
Reply probability is not driven by persuasion alone. It’s shaped by structural variables that operate before a recipient even reads your second sentence. When those variables are misaligned, no subject line can compensate.
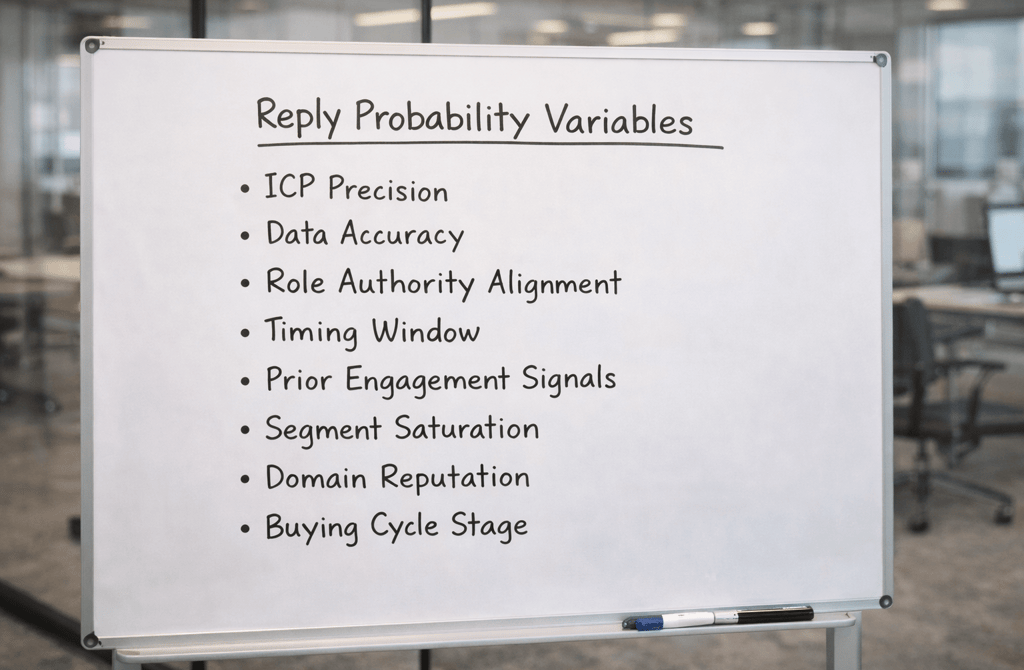
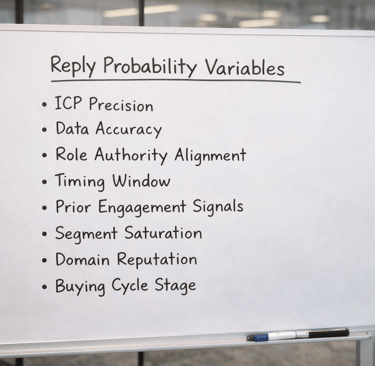
Reply Probability Is a Layered Equation
Most teams look at reply rate as a surface metric. But reply probability is an output of multiple upstream conditions:
Authority alignment
Timing window
Engagement history
Segment saturation
Domain classification
If even two of these variables are misaligned, reply rate becomes unstable.
And instability creates confusion.
Because when the output fluctuates, teams assume the input (the message) is responsible.
Often, it’s not.
Variable 1: Authority Alignment
You can reach the right company and still hit the wrong person.
Targeting a VP when the operational decision sits with a Director creates polite silence. Targeting a Manager when budget authority lives higher up creates forwarding loops without replies.
Reply probability increases when the recipient has both:
Context ownership
Decision influence
Title filtering alone doesn’t guarantee this. Behavioral authority — who actually drives change inside that department — matters more than hierarchy labels.
Loose authority alignment depresses replies without triggering obvious errors.
Variable 2: Buying Cycle Stage
A relevant prospect outside an active buying window behaves like an irrelevant one.
If the company solved the problem last quarter, your outreach feels redundant. If they haven’t yet recognized the issue internally, your message feels premature.
Reply probability spikes when:
Hiring signals align
Funding signals align
Expansion signals align
Regulatory shifts create urgency
Segmentation that accounts for buying momentum performs differently than segmentation based solely on industry labels.
This is why campaigns using tightly refined vertical datasets — such as manufacturing industry B2B leads segmented by operational growth stage — behave differently from broad industry outreach. It’s not the vertical alone that matters. It’s the timing inside that vertical.
Reply probability is momentum-sensitive.
Variable 3: Engagement Concentration
Inbox systems don’t evaluate your campaign in isolation. They observe engagement distribution patterns.
If engagement is concentrated within clearly defined segments, your sender reputation strengthens.
If engagement is scattered thinly across mismatched audiences, classification weakens.
Weak classification reduces inbox visibility.
Reduced visibility reduces opportunity for replies.
Reply probability then drops — even if interest still exists.
Most teams measure replies. Few measure engagement concentration.
Variable 4: Segment Saturation
Outbound volume within a niche creates fatigue effects.
If your target segment receives heavy outreach from similar vendors, reply behavior shifts. Even strong messaging competes against accumulated noise.
Saturation lowers marginal reply probability over time.
This doesn’t mean the segment is wrong. It means outreach strategy must adapt:
Tighter segmentation
Refined positioning
Reduced overlap with over-contacted cohorts
Ignoring saturation leads teams to misinterpret silence as disinterest rather than overload.
Variable 5: Data Freshness
Reply probability decays when data ages.
Role changes, department restructuring, new priorities — all reduce alignment.
Stale data doesn’t just increase bounce rates. It increases non-engagement from contacts who technically still receive the email but no longer match the profile you built the message around.
That non-engagement distorts performance perception.
You may believe your offer lacks appeal. In reality, your dataset lacks recency.
Why These Variables Go Underestimated
Because they are invisible.
Copy can be seen, rewritten, and optimized.
Targeting variables operate beneath the surface.
They require structural thinking instead of creative thinking.
Creative fixes feel productive.
Structural fixes feel slow.
But reply probability is structural first, creative second.
The Real Takeaway
Reply rate isn’t a verdict on your messaging skill. It’s a composite output shaped by authority, timing, data quality, saturation, and engagement classification.
When those variables align, reply behavior stabilizes.
When they drift, performance appears unpredictable — even when your messaging improves.
Outbound doesn’t reward louder persuasion.
It rewards tighter alignment.
When your targeting variables reflect real buyer conditions, reply metrics become meaningful instead of misleading.
When those variables are ignored, reply rate turns into noise rather than signal.
Related Post:
The Hidden Problems Caused by Outdated Job Roles
How Poor Infrastructure Amplifies Minor Data Issues
Why Weak Architecture Triggers Spam Filters Faster
The Domain Reputation Mechanics Founders Should Understand
How Spam Algorithms Interpret Sudden Send Volume Changes
Why Inconsistent Targeting Raises Spam Filter Suspicion
The Inbox Sorting Logic ESPs Never Explain Publicly
How Risky Sending Patterns Trigger Domain-Level Penalties
Why Domain Reputation Is Built on Consistency, Not Volume
The Hidden Domain Factors That Influence Inbox Placement
Why Copy Tweaks Don’t Fix Underlying Data Problems
The Hidden Data Requirements Behind High-Performing Frameworks
Why Framework Experiments Fail When Lists Aren’t Fresh
How Overly Broad Segments Lower Reply Probability
Why Weak Targeting Logic Confuses Inbox Providers
The Real Cost of Using “Catch-All” Segments in Outbound
How Weak ICP Definitions Inflate Your Pipeline With Noise
Why Buyer Fit Accuracy Matters More Than Industry Fit
The Hidden ICP Mistakes That Make Outreach Unpredictable
How Poor Data Creates Blind Spots in Committee Mapping
Why Buying Committees Prefer Consistent Messaging Across Roles
The Contact Layering Strategy Behind Multi-Threaded Sequences
How Engagement Timing Predicts Buying Motivation
Why Intent Data Works Only When the Inputs Are Clean
The Multi-Signal Indicators Behind Strong Reply Rates
How ICP Precision Improves Reply Rate Fast
Why Bad Data Creates False Low-Reply Signals
Connect
Get verified leads that drive real results for your business today.
www.capleads.org
© 2025. All rights reserved.
Serving clients worldwide.
CapLeads provides verified B2B datasets with accurate contacts and direct phone numbers. Our data helps startups and sales teams reach C-level executives in FinTech, SaaS, Consulting, and other industries.